

Art Competitions: A Selective Comparison of Applicant Pools, Awards, and Odds

Arts organizations often tout the winners of competitions; only a few groups publish the number of applications received. Without this data, it’s difficult for artists to gauge the competitiveness of open calls. Selecting residencies, fellowships, grants, and opportunities to apply to can involve research, past experience, word of mouth, and hefty a dose of intuition. Yet artists accrue unpaid hours at their own risk with every submission, not to mention investing nominal fees and expenses.Motivations. A few months ago, I started creating information graphics about art competition odds. I wanted to improve the efficacy of my efforts, and to put my principles into action. I’m convinced that demystifying the art world benefits artists and institutions. Further, artists can fight assumptions, stereotypes, and cynical perspectives by becoming agents armed with knowledge.Approach. I gathered initial figures from the letters I received in response to my applications. To expand the data set, I turned to trusted artist friends who share the principle of mutual aid.[i] I also conducted searches of institutional websites and annual reports, and requested data directly from selected organizations. As to be expected, this data set of 26 competitive programs from 23 organizations is highly selective; I make no claims to achieve a diverse or representative cross-section. In fact, organizations in New York and California are over-represented as a consequence of my personal geography.
Furthermore, accuracy is limited given the tendency for organizations to maintain only a rough count of the number of applications received. For example, Lauren Davies, who runs Kala Art Institute’s Fellowship program, estimated that they received “about 200” applications this year.[ii] I found this kind of approximation (often rounding figures down) very common.
While I focused on visual art opportunities, some opportunities are also open to writers and musicians, with only overall figures available. Additionally, the data is only a snapshot, not an average over time—the charts below strictly reflect competitions held in 2010 or 2011.
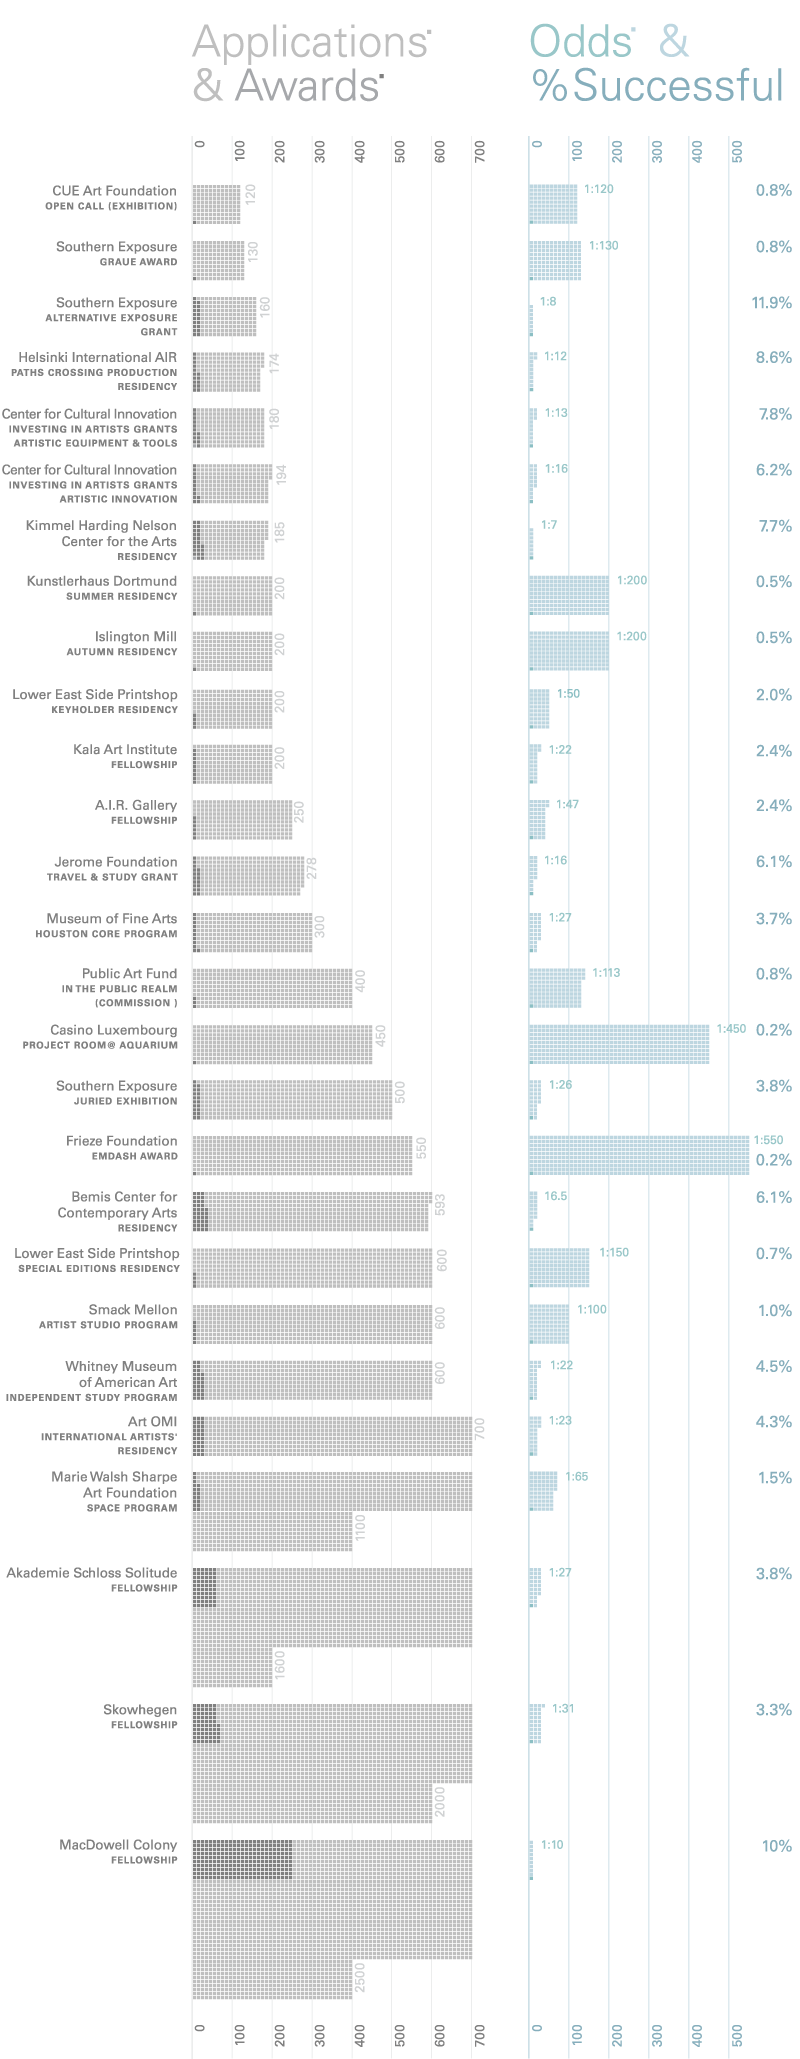
Findings. Once I gathered the data, I parsed it in three ways. The bar chart on the left displays the size of the applicant pools in light grey, with the number of awards/recipients/selected artists in darker grey. Each square represents one application, with 10 in each column. The bar chart on the right presents any given applicant’s statistical odds. It’s accompanied by the percentage of successful applications. Lower odds and higher percentages make for better chances.
The Odds: An Indicator of Competitiveness. The odds seem like the most pragmatic way to evaluate competitiveness. For example, CUE Art Foundation’s Open Call had the smallest applicant pool of 120 submissions, yet with only one selection made, its 1:120 odds ranked as the seventh most competitive. On the other end of the spectrum, the MacDowell Colony Fellowship had the largest number of applications by 500, but it also had the highest number of awards—250 fellows—and consequently, the third most favorable odds with one in 10 applicants receiving a fellowship.
One-Award Competitions. In general, the more awards the program offered, the more favorable its odds were likely to be. Thus competitions offering only one award were highly competitive. All six single-award competitions placed among the top eight most competitive programs. Of those eight, 13 awards were dispersed for a combined applicant pool of 2,650. The most competitive program was the Frieze Foundation’s EMDASH Award, in which 550 applicants vied for a high-profile residency, commission, and exhibition opportunity.
Speculations.
Financial Incentives. I was surprised by the competitiveness of some programs. In particular, the Lower East Side Printshop’s Special Editions Residency ranked as the fourth most competitive overall, and first among U.S. opportunities, with 600 applicants competing for four spots. The Marie Walsh Sharpe Art Foundation’s Space Program culled through some 1,100 submissions to award 17 studio spaces; in a similar program, Smack Mellon received 600 applications for six studios. At first, I speculated that these programs’ popularity might be attributed to financial incentives: Special Editions residents received a stipend of up to $4,000—a figure easily exceeded by the cost of one year’s studio rent, which the latter programs neutralized.
Geography as Attraction. At the same time, all thee programs are based in New York. Indeed, seven of the nine New York programs ranked among the top 11 most competitive.[iii] I surmised that New York competitions attract local artists plus artists from beyond the region seeking a foothold in the city—roles I’ve experienced in the past and present.
Geography as Limit: Two Views. On the other hand, it appears that geographic restrictions might make competitions more favorable in other areas. Programs limited to artists in California comprised three of the top six most favorable in this data set—even when cash was at stake. The most favorable grant surveyed was Southern Exposure’s Alternative Exposure, limited to visual artists or organizations in San Francisco or Alameda County. One in eight applicants received an award. Both grants from the Center for Cultural Innovation, which serves California artists, followed in second and third place as most favorable grants.
Those programs form a stark contrast against Southern Exposure’s Graue Award, a single-award commission un-restricted by region. It ranked as the sixth most competitive overall.
Perhaps a program’s location outside of major art cities doesn’t guarantee less competition when there are international application pools. For example, the third most competitive programs are tied between international residencies at Islington Mill, located outside of Manchester, UK, and Kunstlerhaus Dormund, in Dormund, Germany.
Fees and Publicity. Since Islington Mill’s residency program is relatively new and small—hosting only one artist per season—I suspect that many of the 200 applicants learned about the opportunity from Re-title.com. The fact that the application was entry-fee free did not hurt. On the other hand, prestigious competitions like Skowhegan, which received 2,000 applications despite a hefty $50 entry fee, will likely continue to attract applicants.
If anything is safe to assume, it is that a variety of factors, including financial incentives, geography, publicity, and fees, impact applicant pool sizes and competition odds, but not in any decisive fashion.
Limitations. The data only reveals the numerical facts of the programs’ competitiveness. In filtering this data, I’ve disregarded runner-up prizes and unquantifiable, tangential benefits. For example, Kala’s Davies told me that four Fellowship applicants are selected to receive honorable mentions and a one-month free studio residency. Additionally, Davies carefully reviews each application for consideration for gallery exhibitions.
I wouldn’t like to increase administrative burdens, yet I find the idea of audits of art competitions and the recipients they select quite interesting. It would be useful to compare award recipients’ professional levels, primary media, press coverage, and the likelihood of their social circles overlapping with the host organizations’. How many recipients are local, regional, national or international? How many hold MFAs? How many are women or people of color? What are their median ages? I am curious if trends like these would emerge over time at particular organizations. One especially pertinent question I would pose is this: Among organizations that encourage emerging artists to apply, how often do they actually select them, and in what proportion?
Some art organizations, such as Creative Capital and the Jerome Foundation[iv]—are very specific about what kind of artists should apply and what kind of proposals are successful; to them I’m very grateful. I am frustrated by organizations who cast very wide nets when the artists they have awarded in the past fit a particular profile—whether it’s international or established, comfortably 2-D or 3-D work, or traditional aesthetics.
Even if application fees merely offset the costs of the program, and organizations want to attract the largest pool of entries in order to secure the best applications for its outside jurors, I believe more specificity about which artists should apply would behoove jurors and applicants. If this data has any effect, I hope that organizations take the efforts of applicants into genuine consideration if they do not already, and that artists can be more wily, optimistic, and successful in their application choices.
________
NOTES:
[ii] Email correspondence with the author, June 3, 2011.
[iii] The Jerome Foundation Travel and Study Grant is geographically limited to New York City as well as Minnesota.
[iv] Disclaimer: I am a recipient.
You realize that this is one of those situations where the act of observation (data gathering in your case) will affect the outcome. If artists see this list, they may choose to apply to programs with better than average chances of success. Likewise, they may choose not to waste their effort on programs that display particularly high levels of competitiveness. The result would be to increase the competitiveness of the low-competitiveness competitions and decrease the competitiveness of the high-competitiveness competitions.
In short, there is probably no easy way to “game” one’s entries to maximize one’s chances of winning.
That’s true; of course, if I were interested in gaming the system or increasingy own odds, I wouldn’t bother with sharing my findings. At the same time, my guess is that some programs, despite unfavorable odds, will continue to attract applicants, while others, despite favorable odds, will only attract new applicants at a slower pace. But I think that having the data is better than not in any case.
Sure, programs where the value of the award (whether monetary or otherwise) is especially high will in absolute terms attract more competitors. What would be interesting would be to see what this looks like a year from now–and see if publishing the data caused in change in the numbers of applicants for different prizes.
And I certainly agree that this data is interesting. It’s the kind of data that should be routine for artists to have access to when evaluating which programs/awards to apply for.
Christine, thank you so much for putting this together and sharing your findings! Interesting & very useful.
Hey Christine, just wanted to let you know that I love this article. I was a little confused on the last 2 paragraphs though and was hoping you could explicate -do you think Djerassi accepts only established California & New York artists while making exceptions for emerging international artists? And I clicked on the Blue Mountain Center link and it looks like the alumni are predominantly writers and it seemed the few visual artists were video artists. What do you mean by “comfortably 2-D or 3-D work”?
btw -I’m not defending these institutions but just wondering if I should bother ever applying to them.
Hi Thomas! Thanks for reading. There is data behind many statements in this article, but my decision to link to Djerassi and Blue Mountain Center was based on gut reactions. I wanted to illustrate that while review committees may change, some organizations demonstrate certain tendencies, and that articulating them might well save everyone a lot of time and effort. Whether Djerassi or BMC demonstrate those trends, or that I’m merely perceiving them that way, is difficult to say with any certainty.
But I can say that whether or not you should apply to particular opportunities is a personal decision—one that you have to make based on a variety of factors.
Which reminds me that getting data from those organizations, and others, is an ongoing need.
Robert, your point that longitudinal studies are more robust than one-time surveys is not lost on me. I don’t have the resources to conduct one at this point—and certainly not one of the magnitude required to establish causality (requiring a control set) as you surmise.
Hi Christine,
thanks for this, very enlightening. Perhaps you would like to add Sculpture Space to this list? We can give you our statistics for this last January 2013 review as well as past years.
We awarded 18 residencies out of 196 applicants, we pay $2000 for twomonths that includes housing and studio.
Thanks — MB
I’ve posted a few more thoughts on art competitions after a recent application process: http://blog.christinewongyap.com/2013/01/02/art-competition-oddities/ Given that many residency programs are underfunded and understaffed right now, I decided to leave the organization’s name out of the post, though I have informed them directly about the problems. If they hope to increase their applicant pool, removing unpleasant surprises from their application processes would be a positive first step.
I would love to have these wonderful opportunities standardize their application procedures some.
I have found that the application process is usually
Beyond cumbersome. Mind you it’s not the fault of any single
Institutions application procedure but instead because any artist who wants any chance of getting a residency or opportunity needs to fill out many many applications each cycle. I find Institutions that demand reference letters upfront to be particularly disrespectful of artists time and energy and resources. I’ve made it a point over the last couple years to not fill out any applications that require letters upfront Instead of just asking for contact information. I wish that there was a proper way to give feedback to these institutions to let them know how Taxing the process of applying to opportunities can be.
I agree.
However, I think artists can and should send brief, courteous, professional emails conveying their feedback to institutions. I know that it seems like you’re jeopardizing your chances if you send negative feedback to an institution to which you’re applying, but it’s a petty administrator who would harbor ill will against your submission. And if you aren’t applying, there’s less risk of fallout, so that seems like more reason to send a note.
This may be a fantasy, but I would love to see an ISO (International Standards) for art applications. For starters, I don’t understand why pixel resolution should matter for digital images, if they’re going to be presented on screens or projections in the end. Specifying pixel dimensions should be enough, and smart(er) apps should convert them automatically. Also, character limits (including spaces) is an outcome of programming, but word counts would be more intuitive. An ISO for a statement and biography here, e.g., 100-word statements, 300-word bios, would be welcome over 1,000-character limits on one app, different limits on other apps.
I’m glad that digital applications are increasing in popularity over slides and CDs. Still, there is room for improvement. You should be able to log in directly to your account to manage your images (currently Slideroom only allows administrator-users to log in generally; artist-users can log in only when applying to a competition; bear in mind that a portion—and some times all—of the fees that artists pay always go to these CMSs). Image libraries should be more accessible and intuitive; one shouldn’t have to copy and paste or re-type the image caption info, field by field, as much as I have. And along the lines of CARFAC—guidelines promoting the fair usage of artists’ time—it would be lovely to see some competition fee guidelines, so that individual artists don’t have to ask themselves how much is too much.
Christine, thanks for responding. I couldnt agree more with all you have said. Would you mind emailing me privately? I have drafted a friendly letter that, without sending feedback directly might reach residencies in petition or facebook passaround format and I would like to share it with you.
Hi Jesse, If your goal is to pass around a letter online, you may as well start here. I wonder why your proposal is indirect? It may seem strange to email people you don’t know who seem to be in positions of power related to something you want, but they are people, too, and generally, people can more easily address feedback when you tell them directly and discreetly.
Thank you for some very intelligent and diligent work. A common application is a terrific idea. In addition to the artists who apply, you are asking the kinds of questions any donor to any of these organizations ought to want to know. I look forward to seeing where your effort leads you, and if there’s any way I can help I’d be interested. I have personally had great experiences at Vermont Studio Center, Banff Centre and been AIR at Zion National Park (USA).